A couple of years ago my dad retired. As you’d probably expect from a man who suddenly has around 50 extra hours free in the week, his mind has been afforded the space to think about the important things in life. A Northampton Town season ticket holder, he keeps a spreadsheet of every Northampton player’s contract status and expiry, which I have found valuable on more than one occasion as our squads are refreshed so often I will frequently turn up to a game never having seen at least four starters even though I was only there six weeks earlier. His freedom from work has allowed him to start keeping records.
In the close season after our relegation to League 2 in May, we were talking about the fact Northampton have only once in their history spent more than three consecutive seasons outside of the 4th tier of English football, and yet have never been relegated from the Football League. This hasn’t been for the wont of trying, with a couple of near misses in recent memory and the infamous 1993/94 season where we finished rock bottom of the 92 team football league structure, only to be saved from relegation by the fact that the Conference winners, Kidderminster Harriers, were denied promotion because of an inadequate stadium. But regardless, Northampton are, whatever the pretenses and aspirations (and alleged criminal activity) of a succession of Chairman, a fourth tier club. But, my dad inquired, just how much of a fourth tier club are we? Mid-table, or higher?
So, thankfully for me, he set out on a quest while the majority of the rest of us were at work to answer that question. He manually collected every league table from the four divisions for the last 60 years (1957/58 being the last season where the bottom two tiers were technically level, split into Third Division North and South, before the move the following season into a four division hierarchy) and recorded the position of every club in the league’s structure. Teams which won the top division received a value of 1, teams who finished bottom of the 4th division (it will always be the 4th division to me) received a value of 92. He discovered that over the last 60 years, Northampton’s average league position has been 70.7 (71, rounded up), which is in football league parlance, 3rd in the fourth tier (League 2). So, we’ve been a bottom tier team, but never consistently enough to be bothering the bottom rungs of the ladder. When he looked at the rank of Northampton’s average position against the 117 other clubs to have competed in the last 60 seasons, he discovered we were 83rd, sandwiched between Crewe Alexandra in 82nd (average position: 70.5) and Mansfield Town in 84th (avg: 70.9).
He told me this, and it set off a train of questions in our conversation: just how consistent were Northampton? Who was the most erratic and inconsistent club in the history of the football league (Northampton famously in the 1960’s went up through the leagues from the bottom to the top and back down again in consecutive seasons, which if taken in isolation is gloriously, beautifully inconsistent)? Which teams are currently over-achieving and under-achieving?
It was at this point he handed the data set over to me and told me he didn’t have the time.
What has been the best club team in England?
Let’s get this one out of the way so the fanboys can run off to goad each other and leave the rest of us in peace: Liverpool are the top ranked team in the last 60 seasons with an average position of 5.0, closely followed by Manchester United on 5.2. The North London duo Arsenal (5.7) and Tottenham (8.2) follow in 3rd and 4th, with the remainder of the top 10 made up of Everton (8.7), Chelsea (11.0), Manchester City (14.2), West Ham (14.5), Aston Villa (15.5) and Newcastle (15.8). To be honest though, this is pretty tedious so let’s move onto something far more interesting…
What team has been the most erratic?
Now we’re talking. What team has been the most bat-shit inconsistent, scaling the heights and plumbing the depths without ever really settling? Well, perhaps appropriately considering what happened to the club, the answer is (the original) Wimbledon.
I should at this point clarify the methodology regarding this club, it’s successor MK Dons and it’s phoenix club AFC Wimbledon. I have treated each club as distinct: Wimbledon entered the Football League in 1977 and rose through the divisions to reach the 1st Division (the forerunner to the Premier League). In 2003/04, after the Norwegian speculators that bought the club ran into financial trouble, a three-man committee from the FA declared it ‘not in the best interests of football’ for these men to lose their money and sanctioned the uprooting of the club from it’s South London community into a temporary home at the National Hockey Stadium in Milton Keynes. At this point, the club was officially rebranded as MK Dons. Whilst the continuity from one club to it’s new identity was the justification for a consortium of Milton Keynes businessmen to buy a place in the Championship via an uprooted club, I have decided to ignore that and declare, using my data, that MK Dons did not exist before 2004 because the whole sordid affair leaves such a bitter taste that I feel compelled to spit. The fans of Wimbledon, disgusted by the theft of their football club and the hijacking of their league place by a franchise project, formed their own club, AFC Wimbledon, who worked their way up through the divisions to earn their league place in 2011 (as the MK businessmen should have been made to do if they wanted a club to exploit the growing Milton Keynes market). It remains highlight of the 2017/18 season that MK Dons’ relegation from League 1 (with Northampton funnily enough) means that from next season, they will be playing their football in a league below AFC Wimbledon for the first time. I wish them nothing but misfortune from here on out.
Anyway, back to the original Wimbledon. In their 27 season career in the football league they finished as low as 81st and as high as 6th, and their rise through the leagues and their peak of a 1988 FA Cup win was one of the more remarkable stories in the Football League’s history.

It is worth pointing out at this stage that this only includes seasons within the Football League. If we were to include positions in non-league (far more difficult outside of the National League Conference as the divisions start to split regionally) we would find different results. I’m sure there are clubs that have fallen way, way down and bounced back who could claim to be more inconsistent than Wimbledon, who’s erratic-ism is actually the result largely of a rapid rise
All the members of the top 10 most erratic clubs have spent time wallowing in the depths of the fourth tier, with Wimbledon’s 81st nadir actually pretty good by comparison. Swansea’s great escape of 2003 was followed by a rapid rise through the divisions, and was preceded by a period in the 1980’s when they were also in the top division, making them the most inconsistent club operating today. Burnley in 3rd have a particularly impressive range of finishes, with the last 60 years bringing both a league title 1959/60 and 90th place finish in 1986/87. Carlisle was a name that surprised me as I have always associated them with the bottom two tiers, but then I am too young to remember their bottom placed finish in the first division in 1974/75 or their rapid decent from 29th in 1983/84 to 91st just five seasons later.
The chart at the foot of this article shows all teams by average position and standard deviation, should you wish to look up your team. I am of course compelled to reveal that Northampton are the 33rd most inconsistent team in the Football League’s history, which I must say is surprisingly high considering just how much time we have spent in the bottom division.
Who are the current overachievers and underachievers?
Removing the 25 clubs in this data set which are no longer in the Football League, it is possible to rank the remaining clubs 1-92 by average league position over the last 60 years to tell us based on historical performance where each team should have finished last season (2017/18). Northampton’s rank changes from 83/117 to 79/92, which means we should have been expected to finish 11th in League Two. This is good because it shows that our ignominious relegation from League One (finishing 66th) was an over-achievement. Not only that, it was an over-achievement bettered by only 19 other clubs.
By this logic, the biggest overachievers – a team which would historically expected to finish 13th in League One but did in fact finish 45 places higher, are AFC Bournemouth.

Inconsistency’s Swansea City also should historically have expected a League One finish but are second in this list, although the nature of the divisional hierachy comes into play here because, like Northampton, it is very reasonable to assume that would have been much closer to their expected position if they were in the same division as the better sides from the division below. Burton Albion also over-achieve so much by virtue of not being allow to finish lower than 44th (bottom of the Championship). But generally speaking, the over-achievers list is populated by those on the crest of a wave: Brighton, Burnley and Huddersfield all performed admirably in the Premier League, and Brentford (9th in the Championship) finished much higher than their expected mid-League 1 position.
And so we get to the underachievers, and there are some cautionary tales in there.

There have been headlines made and fan protests encouraged by the staggering mismanagement at most of the above clubs, and there is no surprise to see a lot of the names there. Some are bouncing back despite some having ongoing issues between the owners and the fans (the top two, Coventry and Luton both won promotion from League 2 last season, and Blackburn are back in the Championship from next season), but a lot of the clubs retain a toxic relationship between the terraces and the board – Sunderland, Blackburn, Leeds, Nottingham Forest and Charlton are all current examples of how not to run English sporting institutions. The surprise entries are in 3rd and 4th, where Grimsby’s average rank of 56th (12th in League 1) was certainly higher than expected, although I can remember a time in the late 1990s when they were in the Championship (following a play-off success at the expense of Northampton). Swindon in 4th, despite a Premier League placing in the early 1990s (where they became the first team for 30 years to concede 100 goals in a top flight season), have never struck me as being a high-end League 1 side, but maybe that says more about me.
There are of course some clubs who finished very close to their expected positions. The fans of the aforementioned underachievers will doubtless be tired of hearing Arsenal fans bleating on about ‘underachievement’ when they only finished three places below expected. Indeed, such is the concentration of power at the top of the pyramid that all the big teams finished close to their historical average. But further down the pyramid the symmetry of finishing exactly where you are suppose is not a sign of stagnation in my view, but is rather beautifully poetic: that in an age of uncertainty and upheaval, these teams have ended up right where they belong. So, take a bow: Wolverhampton Wanderers (21st), Plymouth Argyle (51st, ironically consistent following their remarkable rise from the foot of the table to almost making the playoffs), and Crawley Town (82nd). Manchester United and Newcastle also finished exactly on par, but that is far less interesting.
I’ll give the final mention of this blog to Barnet, who you’ve got to feel a little sorry for. The club finished just one solitary place lower than their expected position last season, but unfortunately the fall from 90th to 91st was enough to send them out of the Football League. The blow would sting even more if they were to realise that the team who were expected to finish in 91st place were Morecombe, who finished just a solitary place higher than expected, in Barnet’s 90th position, thus retaining their Football League position.
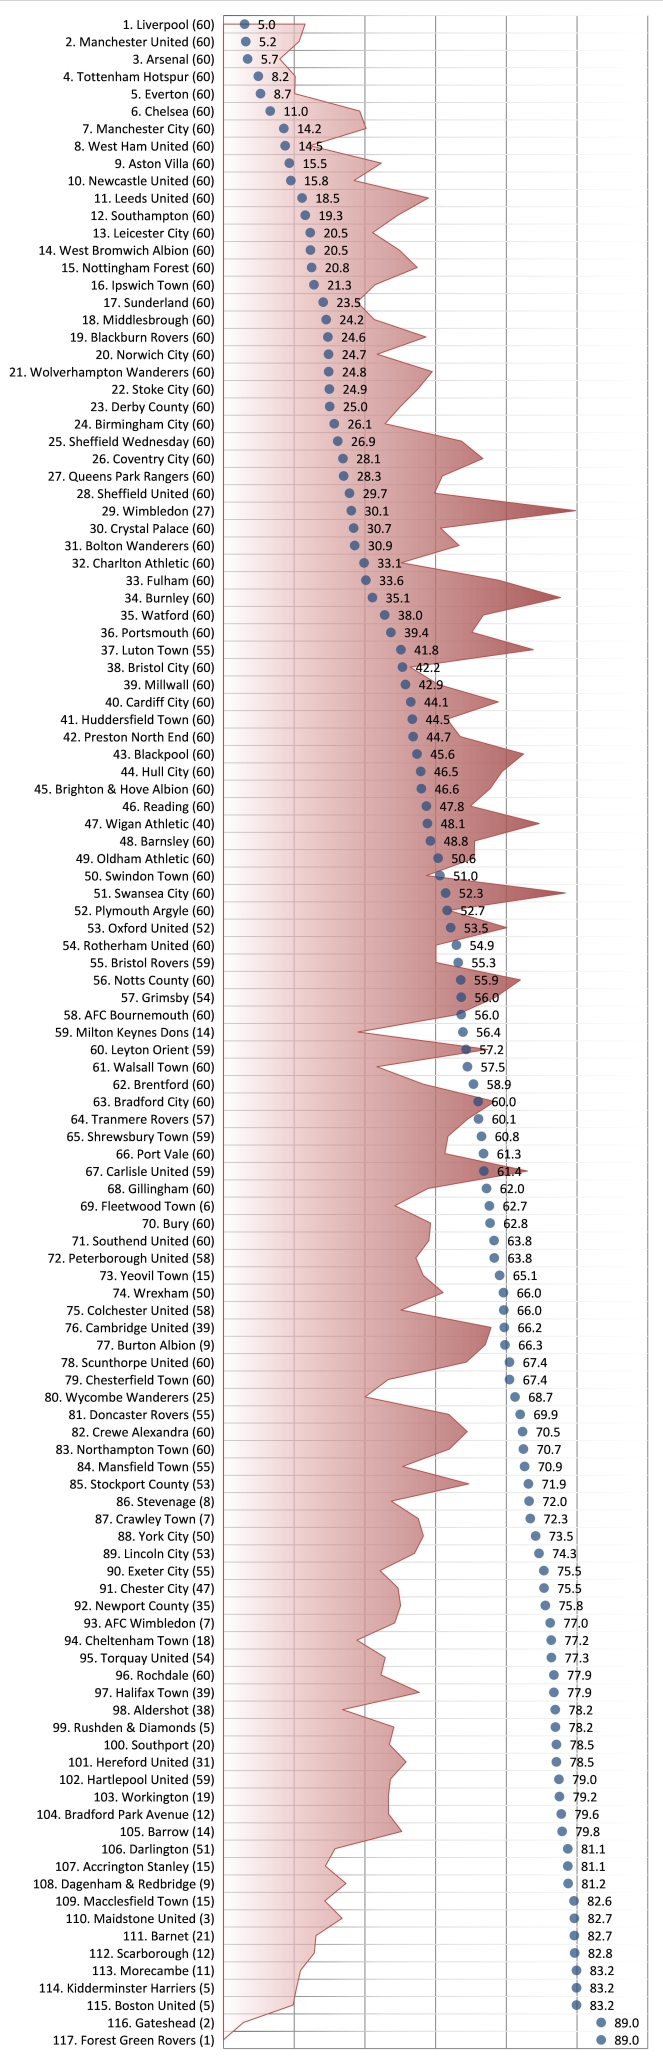
Figure 1: Average league position since 1957/58 (blue dots) vs. the standard deviation of the positions (red area), ordered by rank. Parentheses indicate how many seasons in the Football League have contributed to the scores.

Argyle next to Swansea, although we are yet to have our day in the sun
LikeLike